The contents are
https://yip.su/25X8U6
I’m not opening a random link on a Soviet Union domain.
The contents are
https://yip.su/25X8U6
I’m not opening a random link on a Soviet Union domain.


“Trust me, you just need to buy more compute for your car. We’ll figure out reliable driving by sight someday.”


It’s not pretending to be genuine


I don’t mind seeing vids with small numbers (many are genuinely cool) but I avoid 500k and above (except music) because the mainstream is mostly clickbait.


Literally ISO
https://www.iso.org/obp/ui#iec:grs:60417:5988
And yes, we use switches but the lower network layers abstract that away and a LAN is still like a single bus on the network layer and up.


It’s a joke, note the conflation of port (physical connector) and port (one of 65536 virtual TCP/UDP pathways for applications). Also, HTTP(S) (port 80 or 443 by default) is literally “Hypertext Transfer Protocol” so it’s fair to say it was designed to carry HTML.


What is the <--> port for? HTML? I thought that was port 80 or 443…
It’s an LLM, for fuck’s sake. Are they just going after buzzwords? I don’t want to talk with the car about what the best (paying most for Google Maps placement) pizzeria around is, I’ll decide that before the cab arrives. Just let me pick the address or coordinates in the app and shut up.


That’s mild, I’d say every Israeli in the yellow region shoild GTFO


Do it. The crimes are almost entirely by him personally, and had unprecedented damage. He should be responsible with all his money - a Twitter-sized blow would be a slap on the wrist as the platform is worth just $5B or thereabouts.


Does not matter, hydrogen is not really the future
Valve is proving that LOTS of people would use Linux if it came in convenient preinstalled packaging.


Imagine if Intel snapped and disabled Stephen Hawking’s wheelchair and computer, and he needed to pay for a new one with a different voice, absolutely helpless without it.


Two RJ ports on a laptop? Some of us are lucky to get one!


all Linux distros
This is not a Linux problem; Windows 10 would fare way worse. Maybe similar on a Pi 5, I’ve seen a review and it handles Full HD on either OS (only Linux can get consistent 1080p60 though).


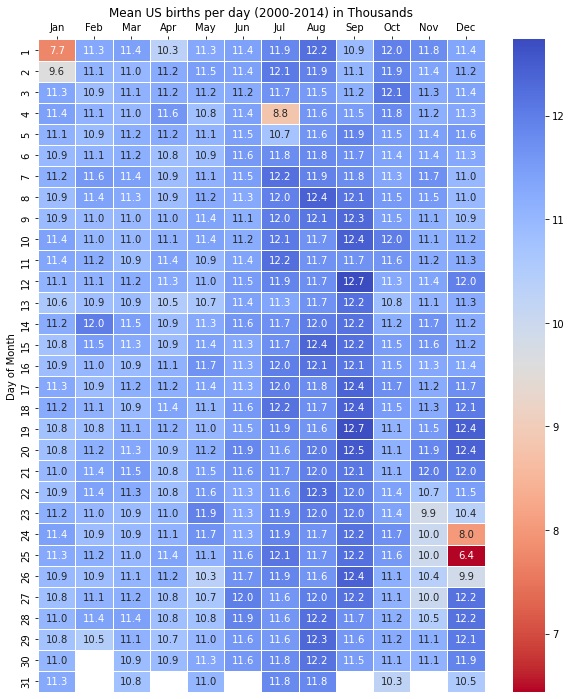
Don’t forget the weekdays. The total births in the dataset by weekday are:
SUN |||||||||||||||||||||||| 5886889
MON ||||||||||||||||||||||||||||||||||||| 9316001
TUE ||||||||||||||||||||||||||||||||||||||||| 10274874
WED |||||||||||||||||||||||||||||||||||||||| 10109130
THU |||||||||||||||||||||||||||||||||||||||| 10045436
FRI ||||||||||||||||||||||||||||||||||||||| 9850199
SAT |||||||||||||||||||||||||| 6704495


The color scale is terrible. Here is a more credible chart based on presumably the same data by Social Security Administration, covering 62,187,024 US births (2000-2014).

Meanwhile, the post’s chart’s actual Reddit OOP is u/plotset, an account made to shill PlotSet.com, a data visualization software.
They had this to say about the data:
This data represents 4,153,303 US-born babies only between 2000 and 2014.
Top 10 Most Common: Sep 12 (0.307%) Sep 19 (0.306%), Sep 20 (0.302%), Dec 19 (0.300%), Sep 10 (0.300%), Dec 20 (0.299%),Sep 18 (0.299%), Aug 8 (0.299%), Sep 26 (0.299%), Sep 17 (0.298%)
Top 10 Least Common: Dec 25 (0.155%), Jan 1 (0.186%), Dec 24 (0.193%), Jul 4 (0.212%), Jan 2 (0.231%), Dec 26 (0.238%), Nov 23 (0.238%), Nov 25 (0.240%), Nov 27 (0.241%), Nov 24 (0.241%)
Data Source: Kaggle.com/datasets/ayessa/birthday
Tools: PlotSet.com
Note that the “4,153,303” figure is bullshit. It is close to births per year but does not actually correspond to the sum in any of the 15 years, nor the average.
Also, neither chart normalizes by weekday: 3 of the years in question started on Tuesday and Saturday while only 1 on Friday, causing most of the variation that got amplified by OOP’s terrible color range. (Because of leap years, I made a table of most common starting weekdays for each month; see my other comment. For example, one of the most common birthdays, August 15, was more often Wednesday or Friday than Saturday.) Without doing weird math, one can ensure the effect of weekdays is largely mitigated by using data from 28 consecutive years, which I believe can be pieced together from several good online sources but I’ll be leaving that as an exercise to the reader.
The contents are
I’m not opening a random link on a Soviet Union domain.
Also, half of the QR code is filler (notice the repeating pattern), it could have been much smaller.