
- cross-posted to:
- firefox@lemmy.ml
- cross-posted to:
- firefox@lemmy.ml
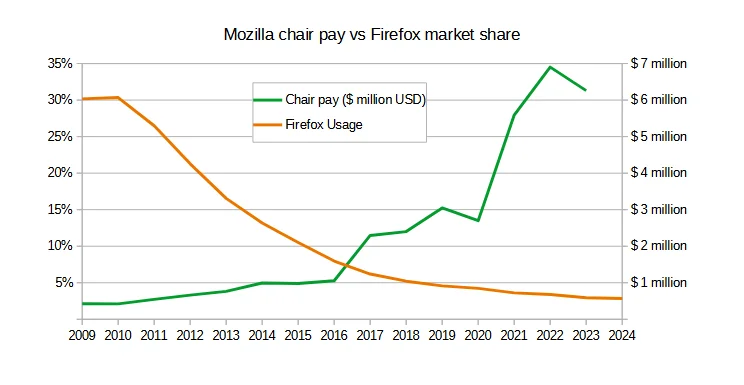
Total 2022 pay: $6,903,089
Total 2023 pay: $6,260,072 - a $643,017 decrease
Base chair pay: $600,000
2023 chair bonuses and other incentives: $5,622,600
Sources:
For comparison, here are other executive salaries ($0 bonuses for each)
| Executive name | Title | Total Pay (2023) |
|---|---|---|
| MARK SURMAN | PRESIDENT & EXECUTIVE DIRECTOR | 715,143 |
| J. BOB ALOTTA | SVP, GLOBAL PROGRAMS | 508,138 |
| ANGELA PLOHMAN | COO, SECRETARY & TREASURER | 452,234 |
| ASHLEY BOYD | SVP, GLOBAL ADVOCACY | 427,701 |
| ZHILUN PANG | DIRECTOR OF FINANCE | 273,069 |
| DAVID WALKER | SENIOR COUNSEL | 268,565 |
| LAINIE DECOURSY | DIRECTOR, ORG EFFECTIVENESS | 267,028 |
| JUAN BARANI | SENIOR DIRECTOR, GIFT PLANNING | 262,879 |
| STEPHANIE WRIGHT | SR PROGRAM MANAGER, MOZFEST | 236,785 |
This graph makes it look like increasing the salary of the chair significantly slowed down the loss of their users, was this what you intended by it?
From a page about geometric percent decreases, explaining that that kind of graph represents an unchanging loss of a percentage of the measured value every interval:
The sequence 100, 50, 25, 12.5, … is a geometric sequence. The common ratio is 1/2. To go from term to term, you keep multiplying by 1/2 (i.e., dividing by 2).
The graph of the sequence 100, 50, 25, 12.5, … is shown below: